

 GitKraken Desktop
 GitLens for IDEs
  GitKraken MCP
 GitKraken CLI
 GitKraken Insights
 Git Integration for Jira
 Supercharge Your Dev Team
  Secure Your Dev Team
 X
Your team can experience GitKraken Desktop On-Premise with all of its features, plus onboarding & support, 100% free of charge. We’re here to answer any questions about the product or pricing. In the meantime, we’ll create a trial license key and send you the details so you can take it for a test drive.

This large regional health plan has a complex engineering organization spanning multiple divisions, including infrastructure, application delivery, and provider networks. With 600+ developers working across dozens of repositories, engineering leaders faced a familiar problem: they had no unified way to measure what was actually happening in their development pipeline.
Managers needed visibility into core delivery metrics like cycle time, PR review time, commit volume, and merge frequency. But they also had more nuanced requirements. Some teams worked on shared features that spanned multiple repositories, and when one team’s work stalled, it created a cascade of delays in downstream environments. These cross-team dependency bottlenecks were impossible to diagnose because they were invisible within their existing stack of Git provider dashboards, manual spreadsheets, and tribal knowledge. Nothing connected the dots across repos, branches, or deployment environments.
The organization also manages a mix of on-shore and off-shore development teams, as well as external vendor teams. Leaders needed a way to compare delivery patterns and identify disconnects across these groups without building yet another internal dashboard.
Before discovering Insights, the DevOps team had tried to solve this the way most engineering organizations do: they built their own. Custom scripts to pull data from their Git provider. Manual processes to aggregate and format it. Spreadsheets to share it.
It worked, but barely. The data was limited to basic metrics their Git provider exposed. The maintenance burden was constant. Every time a team restructured, a repo moved, or a process changed, someone had to go update the scripts. And the solution could never scale to cover the full breadth of what a 600-developer organization actually needed to see.
This is a pattern GitKraken sees across the industry. Teams tell themselves they can build a metrics dashboard over a weekend, and technically they can. But what starts as a weekend project becomes a permanent maintenance commitment: updating queries when schemas change, re-mapping teams when the org restructures, adding new metrics when leadership asks for something the scripts were never designed to produce. The total cost of ownership far exceeds what anyone budgeted for, and the result is still fragile, limited, and dependent on whoever built it.
We had to build custom software just to get basic visibility into our delivery pipeline, and it still couldn't do half of what we needed. The maintenance alone was a full-time job. When I saw what Insights could do out of the box, I started reaching out to every manager I know. Nobody else is offering anything like this at this price point."
Manager, DevOps
Take an interactive tour to see how GitKraken Insights helps teams quantify AI’s impact, spot bottlenecks, and prove engineering ROI.
Book your demo for a one-on-one walkthrough of GitKraken Insights featuring real data and actionable engineering intelligence.
The organization was already a GitKraken customer. Roughly 300 developers relied on GitKraken Desktop for day-to-day Git workflows, managing thousands of commits across dozens of repositories, resolving merge conflicts, and navigating complex branching strategies. When they learned that GitKraken now offered engineering intelligence capabilities through Insights, the reaction was immediate.
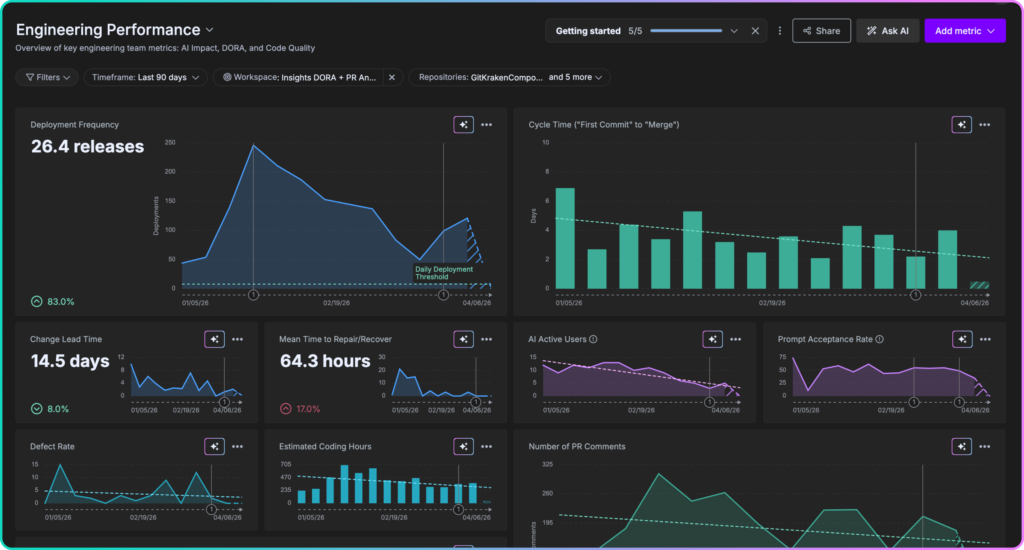
GitKraken Insights includes all four DORA metrics with trend context that matters for decision-making.
What made the decision straightforward wasn’t just the feature set. It was the combination of depth, speed, and flexibility:
- Full delivery pipeline visibility: Cycle time, PR review time, commits, merged PRs, rework rate, code churn, and PR size, all available out of the box and all going far deeper than what their Git provider could surface natively.
- Team-level filtering: The ability to set up teams in GitKraken and filter all dashboards by team, making it straightforward to compare on-shore vs. off-shore performance or monitor vendor team activity.
- Cross-repo dashboards: Dashboards spanning multiple repositories gave leaders a way to see how work flows across teams and environments, not just within individual repos. This directly addressed the cross-team dependency problem that was previously invisible.
- Flexible licensing: Insights-only licenses made it easy to roll out metrics across all 600 developers, regardless of which Git client individual contributors prefer. Leaders get full visibility without changing anyone’s existing workflow.
- AI coding tool impact measurement: As the organization rolls out AI coding assistants, Insights provides the data to quantify what those tools are actually doing to code quality, review cycles, and throughput, giving leaders the evidence they need to justify continued investment.
- Voice of the Developer surveys: Built-in developer sentiment surveys let leaders pair hard delivery metrics with qualitative feedback, keeping a pulse on how developers actually feel about their tools, processes, and workload.
- Fast setup, low maintenance: Unlike the custom solutions they had built before, Insights was ready to go in under a day with no ongoing maintenance overhead. No scripts to update, no queries to fix, no weekend projects that turn into permanent jobs.
Once leaders saw what Insights could surface, the decision to go org-wide was straightforward. The organization expanded from 300 to 600 developers on the platform, giving every division access to the same delivery metrics for the first time. No more team-by-team reporting. No more inconsistent definitions of cycle time or throughput. One platform, one set of metrics, one source of truth.
The rollout was championed by the DevOps management team, who saw an opportunity to standardize how engineering performance is measured across the entire organization. The key use cases they deployed against tell the story:
- Delivery health monitoring: Tracking cycle time, throughput, and review efficiency across teams to identify bottlenecks before they impact release timelines.
“PR review time, commit volume, rework rate, code churn… every one of those is a conversation I used to have to guess my way through. Now I have the data.” — Application Delivery Manager
- Cross-team dependency diagnosis: Spotting gaps in repo activity between branches that deploy to specific environments, revealing where one team is blocking another from promoting code.
“One team can’t promote to the next branch or environment until another team’s repo gets there. Being able to see that gap changes everything.” — Manager, DevOps
- On-shore/off-shore team comparison: Filtering dashboards by team composition to identify and remediate disconnects between distributed groups, turning subjective impressions about offshore velocity into objective data.
- Vendor team accountability: Monitoring external contractor activity with the same metrics used for internal teams. When vendor teams are measured the same way as internal teams, accountability conversations become straightforward.
- AI tool rollout validation: Establishing baseline metrics before and after AI coding tool adoption so leaders can see the real impact on throughput, code churn, and review patterns, not just anecdotal feedback.
- Developer sentiment tracking: Using Voice of the Developer surveys to complement delivery metrics with qualitative feedback, ensuring that process changes and tooling investments are landing well with the people doing the work.
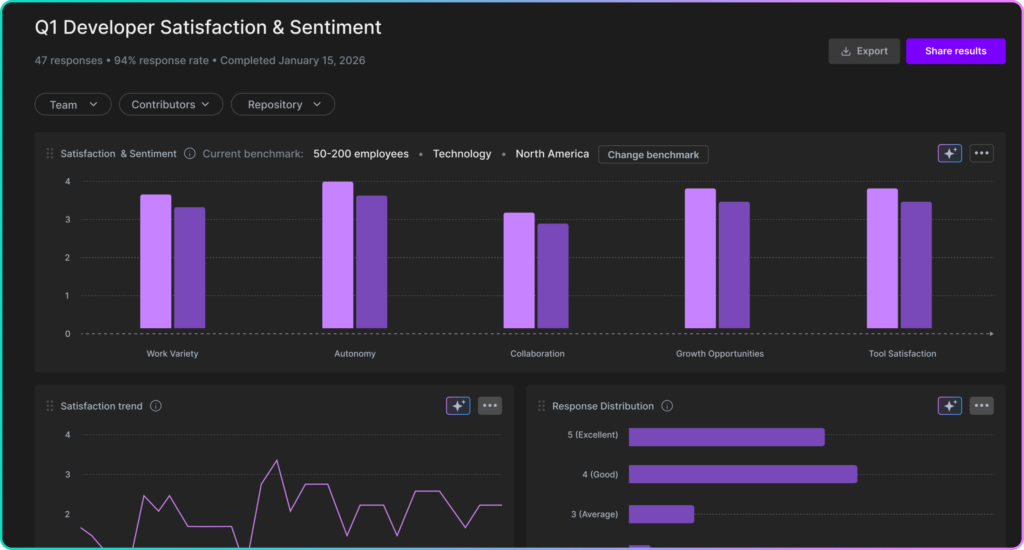
Create flexible surveys that correlate developer sentiment with engineering metrics—so you can connect how your team feels to how they’re performing
With Insights deployed across all 600 developers, the engineering leadership team now operates with a level of visibility that was previously out of reach:
- One view across every team: For the first time, every division is measured with the same metrics on the same platform. Leaders can compare performance across groups, identify patterns, and make resourcing decisions based on data instead of anecdotes.
“This goes way beyond the simple metrics you can pull from your Git provider. We can finally see how our teams are actually performing and where the bottlenecks are between groups.” — Manager, DevOps
- DevOps time reclaimed: The team stopped building and maintaining custom dashboards entirely. The capacity that used to go toward internal tooling is now available for higher-value infrastructure and platform work.
“The maintenance alone was a full-time job. That time goes back to real engineering work now.” — Manager, DevOps
- Cross-team blockers surfaced early: Dependency bottlenecks between teams that used to go undetected for days or weeks are now visible as they happen, enabling proactive intervention before they cascade into missed release windows.
- Distributed team accountability: On-shore, off-shore, and vendor teams are all measured the same way, making performance conversations objective and consistent regardless of where the team sits.
- Confidence in AI investments: A clear before-and-after framework for AI coding tool rollouts gives leadership the data to double down on what works and course-correct what doesn’t, replacing gut feel with evidence.
- The full picture, not just the numbers: Developer sentiment surveys ensure leaders understand not just what is happening in the pipeline, but why, catching morale and process issues that metrics alone would miss.
