 GitKraken Desktop
 GitLens for IDEs
  GitKraken MCP
 GitKraken CLI
 GitKraken Insights
 Git Integration for Jira
 Supercharge Your Dev Team
  Secure Your Dev Team

The AI Multiplier Effect
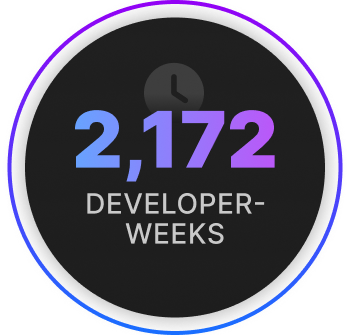
What 2,172 Developer-Weeks Reveal About AI’s Real Impact
Download the Full Report →
We respect your privacy and will never share your information.
AI does not create 10x engineers. It amplifies what is already there.
Engineering leaders are navigating a familiar tension: pressure to adopt AI tools quickly, paired with skepticism about the hype. Analysis of 2,172 developer-weeks across teams using GitHub Copilot, Cursor, and Claude Code offers a clearer picture of what AI actually delivers, and what it demands in return.
4–14x Higher Activity
AI power users show 4–14x higher activity levels than non-users across multiple metrics.
95% Adoption Rate
One survey of software engineers shows that 95% are using AI on at least a weekly basis (source).
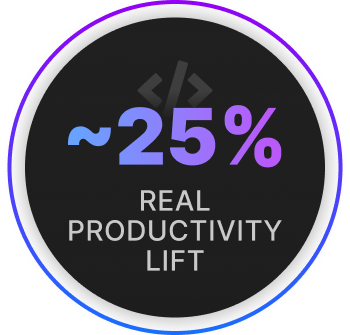
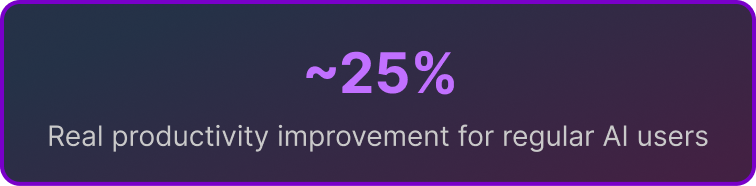
25% YoY Improvement
Approximately 25% year-over-year improvement when isolating AI's actual contribution.
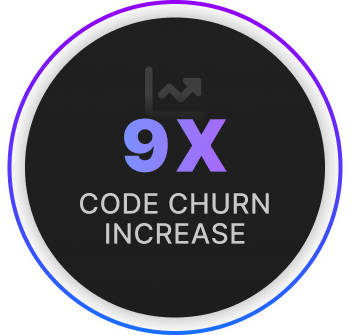
9x Higher Code Churn
9x higher code churn among heavy AI users. More code written and quickly rewritten.
WHAT YOU WILL LEARN
This report breaks down what the data actually shows, who benefits most from AI coding tools, what risks require monitoring, and how to build a measurement framework that captures benefits while managing trade-offs. Whether you are scaling AI adoption or just getting started, this research provides a foundation for making informed decisions.
Output Gap
The headline numbers from this research are eye-catching. Analysis of 2,172 developer-weeks revealed a massive activity gap between developers who use AI coding tools heavily and those who do not. The differences are not subtle.
The AI Activity Gap
The data suggests Power Users tend to be senior engineers who push code with less third-party review, or work at startups with different PR practices. This pattern is one of the first clues that something more complex is happening.
The AI Activity Gap
Activity multiplier compared to developers who do not use AI tools
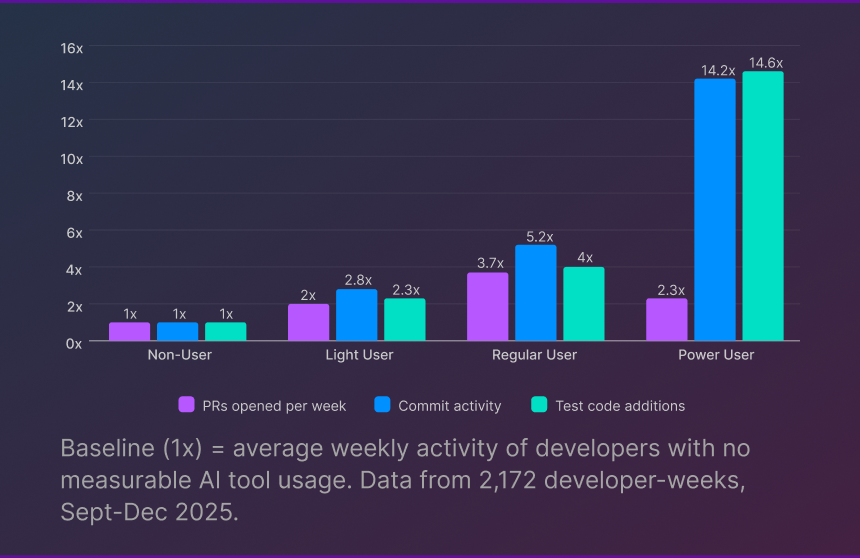
The numbers are striking. Power users show 14x higher commit activity than non-users. Regular users open 3.7x more pull requests per week. Power users add 15x more test code. Across nearly every activity metric tested, developers with high AI usage dramatically outpace those without.
These are real differences in real codebases. But they raise an obvious question: if AI tools delivered 10-15x productivity gains, every company would have already cut their engineering teams in half. That hasn’t happened, and it’s worth asking why.
The Confounding Factors
The numbers are striking. Power users show 14x higher commit activity than non-users. Regular users open 3.7x more pull requests per week. Power users add 15x more test code. Across nearly every activity metric tested, developers with high AI usage dramatically outpace those without.
These are real differences in real codebases. But they raise an obvious question: if AI tools delivered 10-15x productivity gains, every company would have already cut their engineering teams in half. That hasn’t happened, and it’s worth asking why.
These factors cluster together. The developers most likely to adopt AI heavily are the same developers who were already high performers in high-velocity environments during their most productive weeks.
The Overlapping Factors Behind High AI Activity
Why correlation between AI use and output does not imply causation
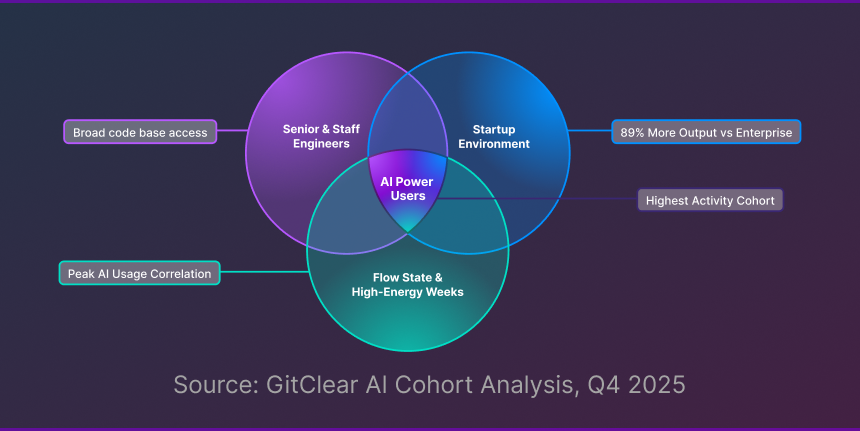
Senior engineers adopt AI early. They already touch more of the codebase, prototype aggressively, and push code with less review friction. Their activity metrics would look impressive with or without AI assistance. The data shows patterns consistent with senior developers, though experience level was not directly measured.
Startups move fast and adopt faster. Teams at early-stage companies have less legacy code to navigate, fewer approval processes to slow them down, and a culture that rewards shipping quickly. They are also first to experiment with new tools. Some of what looks like an AI effect is really a startup effect. GitClear’s data shows startup developers produce nearly twice the output of enterprise developers on average.
Developers in flow states use AI more. When you are deep in a problem, prototyping a new feature, or pushing through a high-energy week, you reach for every tool available. Heavy AI usage correlates with these productive periods, but the causation may run in the opposite direction. AI might be the companion to high output, not the cause of it.
What This Means for Your Team
What This Means for Your Team
Before attributing productivity gains to AI, control for these variables. Compare similar developers working on similar project types during similar timeframes. The good news: these confounding factors can be measured and accounted for. With the right instrumentation, you can isolate AI’s actual contribution to your team’s output
So if these confounding factors explain most of the gap, what is AI actually contributing? To answer that question, researchers took a different approach: comparing developers against their own past performance.
A Note on the Data: The research identifies behavioral patterns consistent with senior engineers (broad codebase access, early tool adoption) but does not directly measure developer experience level. The seniority hypothesis is inferred from behavior, not confirmed by job title data. Future research segmenting by explicit experience level would help validate these findings.
Take A Guided Tour Of GitKraken Insights →
The Real Number
Isolating AI’s actual contribution by comparing developers to themselves
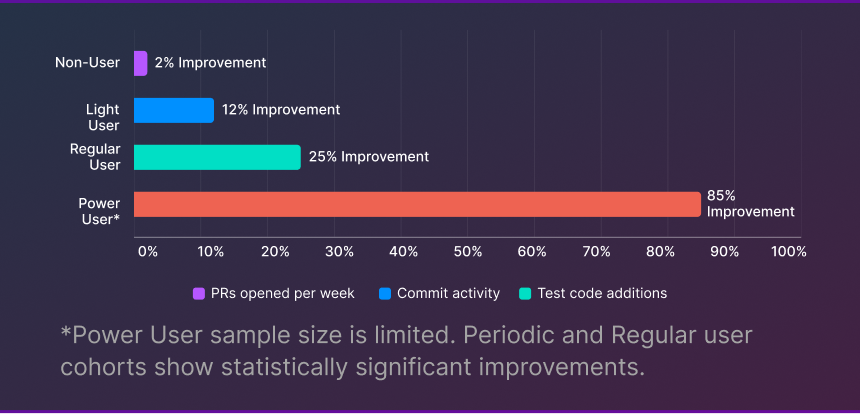
To isolate AI’s actual impact, researchers compared developers against themselves: their output in 2025 versus the same week in 2024, when AI tools were less capable and less pervasive. This controls for individual skill level, project context, and company environment.
User
*Power User sample size is limited. Periodic and Regular user cohorts show statistically significant improvements.
Year-Over-Year Improvement by AI Usage
Same developers, same week, one year apart


Genuine AI Benefits Observed
More test code gets written. Regular AI users produce 4x more test coverage additions than non-users. When the friction of writing boilerplate tests drops, developers actually write them. JetBrains research confirms this pattern: developers rank test writing as one of the tasks they most want to delegate to AI. This is one of AI’s clearest wins.
Review burden scales better than output. High AI users generate 4x more output but only 3x more review time required from teammates. AI-assisted code appears to reach reviewable quality more efficiently. Code review comments per PR also decreased among regular AI users, suggesting AI-assisted code arrives in better shape.
Take A Guided Tour Of GitKraken Insights →
Take A Guided Tour Of GitKraken Insights
The Trade-offs
More output is not free. The data reveals risks that require monitoring.
The Hidden Cost of Speed
Side effects scale faster than productivity gains
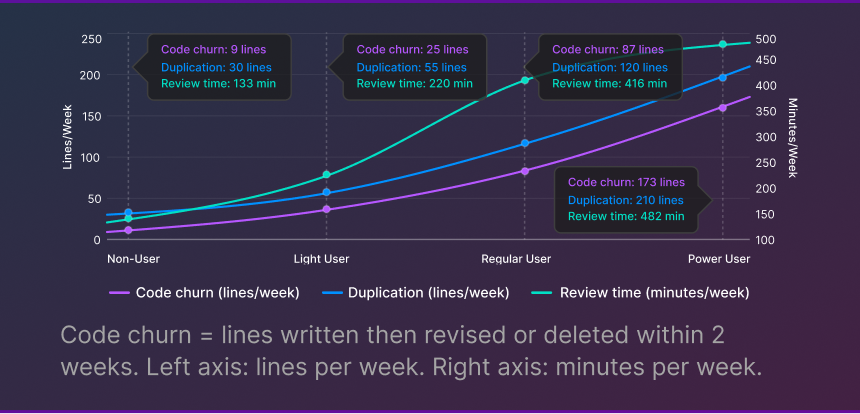
What Code Churn Signals
- Rapid iteration, which is not necessarily bad in prototyping phases
- Less upfront planning before coding begins
- AI suggestions that technically work but need refinement
- Potential accumulation of technical debt if not managed
Copy/paste patterns are also 4x higher among heavy AI users. While this tracks with their output increase, it suggests AI tools still struggle with DRY principles (Do Not Repeat Yourself). Duplicated code creates hidden coupling and increases the surface area for bugs.
Why This Matters
Why This Matters
High churn today can become maintenance burden tomorrow. Teams optimizing purely for speed may be accumulating invisible debt that slows them down within 6-12 months. The pattern is familiar: velocity looks great in the short term, then gradually degrades as the codebase becomes harder to change.
These Risks Are Manageable
The data suggests successful AI users are catching and fixing quality issues before code reaches production. But that requires engineering discipline, experienced reviewers who know what to look for, and visibility into the right metrics. Teams that track churn and duplication in real-time can establish healthy thresholds and catch problems before they compound.
Watch A Full Demo Of GitKraken Insights →
What to Measure
A framework for capturing AI benefits while managing risks
If AI amplifies existing performance and introduces new risks, you need visibility into both. The following framework covers four categories of metrics that, together, give you a complete picture of AI’s impact on your team. Whether you build this measurement capability in-house or use a dedicated platform, the key is making these metrics visible to the people who can act on them.
Practical Next Steps
This Week
Understand your current AI adoption landscape. A quick survey or async Slack thread can surface who is using which tools and for what tasks. You cannot measure AI’s impact if you do not know who is using what. Focus on understanding workflows, not counting commits.This Month
Add a churn metric to your existing dashboards. Most git analytics platforms can track lines changed within 14 days of original commit. Establish a baseline before making any changes to AI policy or tooling. If you do not have git analytics in place, this is a good forcing function to start.This Quarter
Correlate AI usage with quality metrics at the team level. Are teams with higher AI adoption seeing different defect rates? Different review patterns? This analysis will tell you whether AI is a net positive in your specific environment, and where guardrails might be needed.A Note on Tooling
A Note on Tooling
Tracking these metrics manually is possible but time-consuming. Many teams start with custom queries and spreadsheets, then graduate to purpose-built platforms as their needs grow. The important thing is to start measuring before you scale AI adoption, so you have a baseline to compare against.
Take A Guided Tour Of GitKraken Insights →
The Bottom Line
AI coding tools are not magic. They are force multipliers.
1. Adopt but measure
2. Invest in your High Performers
3. Build guardrails, not walls
4. Set Realistic Expectations
The Real Question
The Real Question
The question is not whether AI makes developers more productive. The data says yes: about 25% more productive, with meaningful benefits for test coverage and review efficiency. The question is whether you are measuring the right things to capture those benefits sustainably. The teams that answer that question will be the ones who turn AI from a hype cycle into a lasting advantage.
Ready to Move from Theory to Practice?
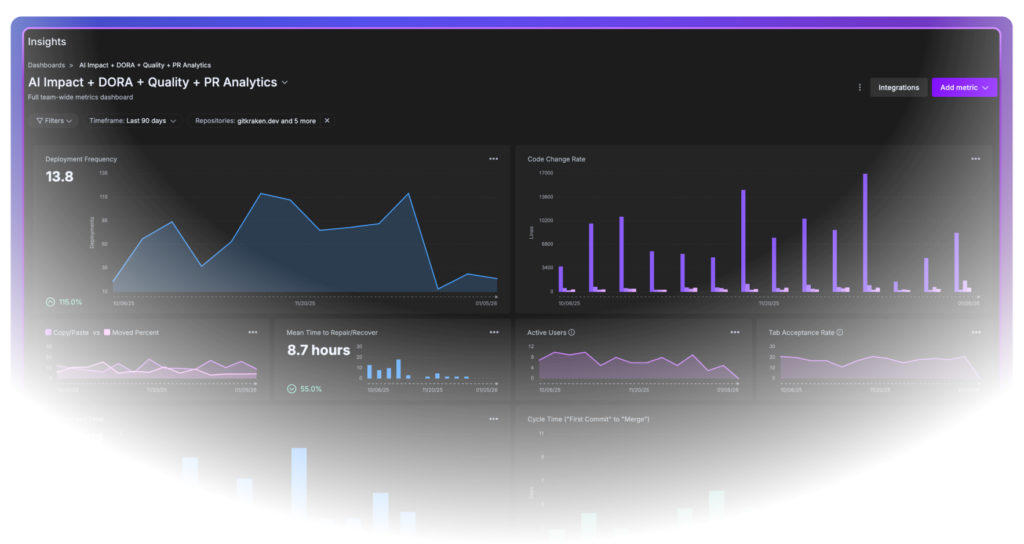
See what AI is really doing to your engineering metrics.
GitKraken Insights helps engineering leaders measure AI’s true impact on productivity, code quality, and developer experience. Track the metrics from this report automatically, establish baselines, and catch quality issues before they compound. Full-stack developer intelligence in 15 minutes, at 75% less than enterprise alternatives.
Download the Full Report →
Read it offline, on mobile, or whenever it’s most convenient. No spam, just a PDF in your inbox.
Research conducted in partnership with GitClear. Based on analysis of 2,172 developer-weeks, September-December 2025.
