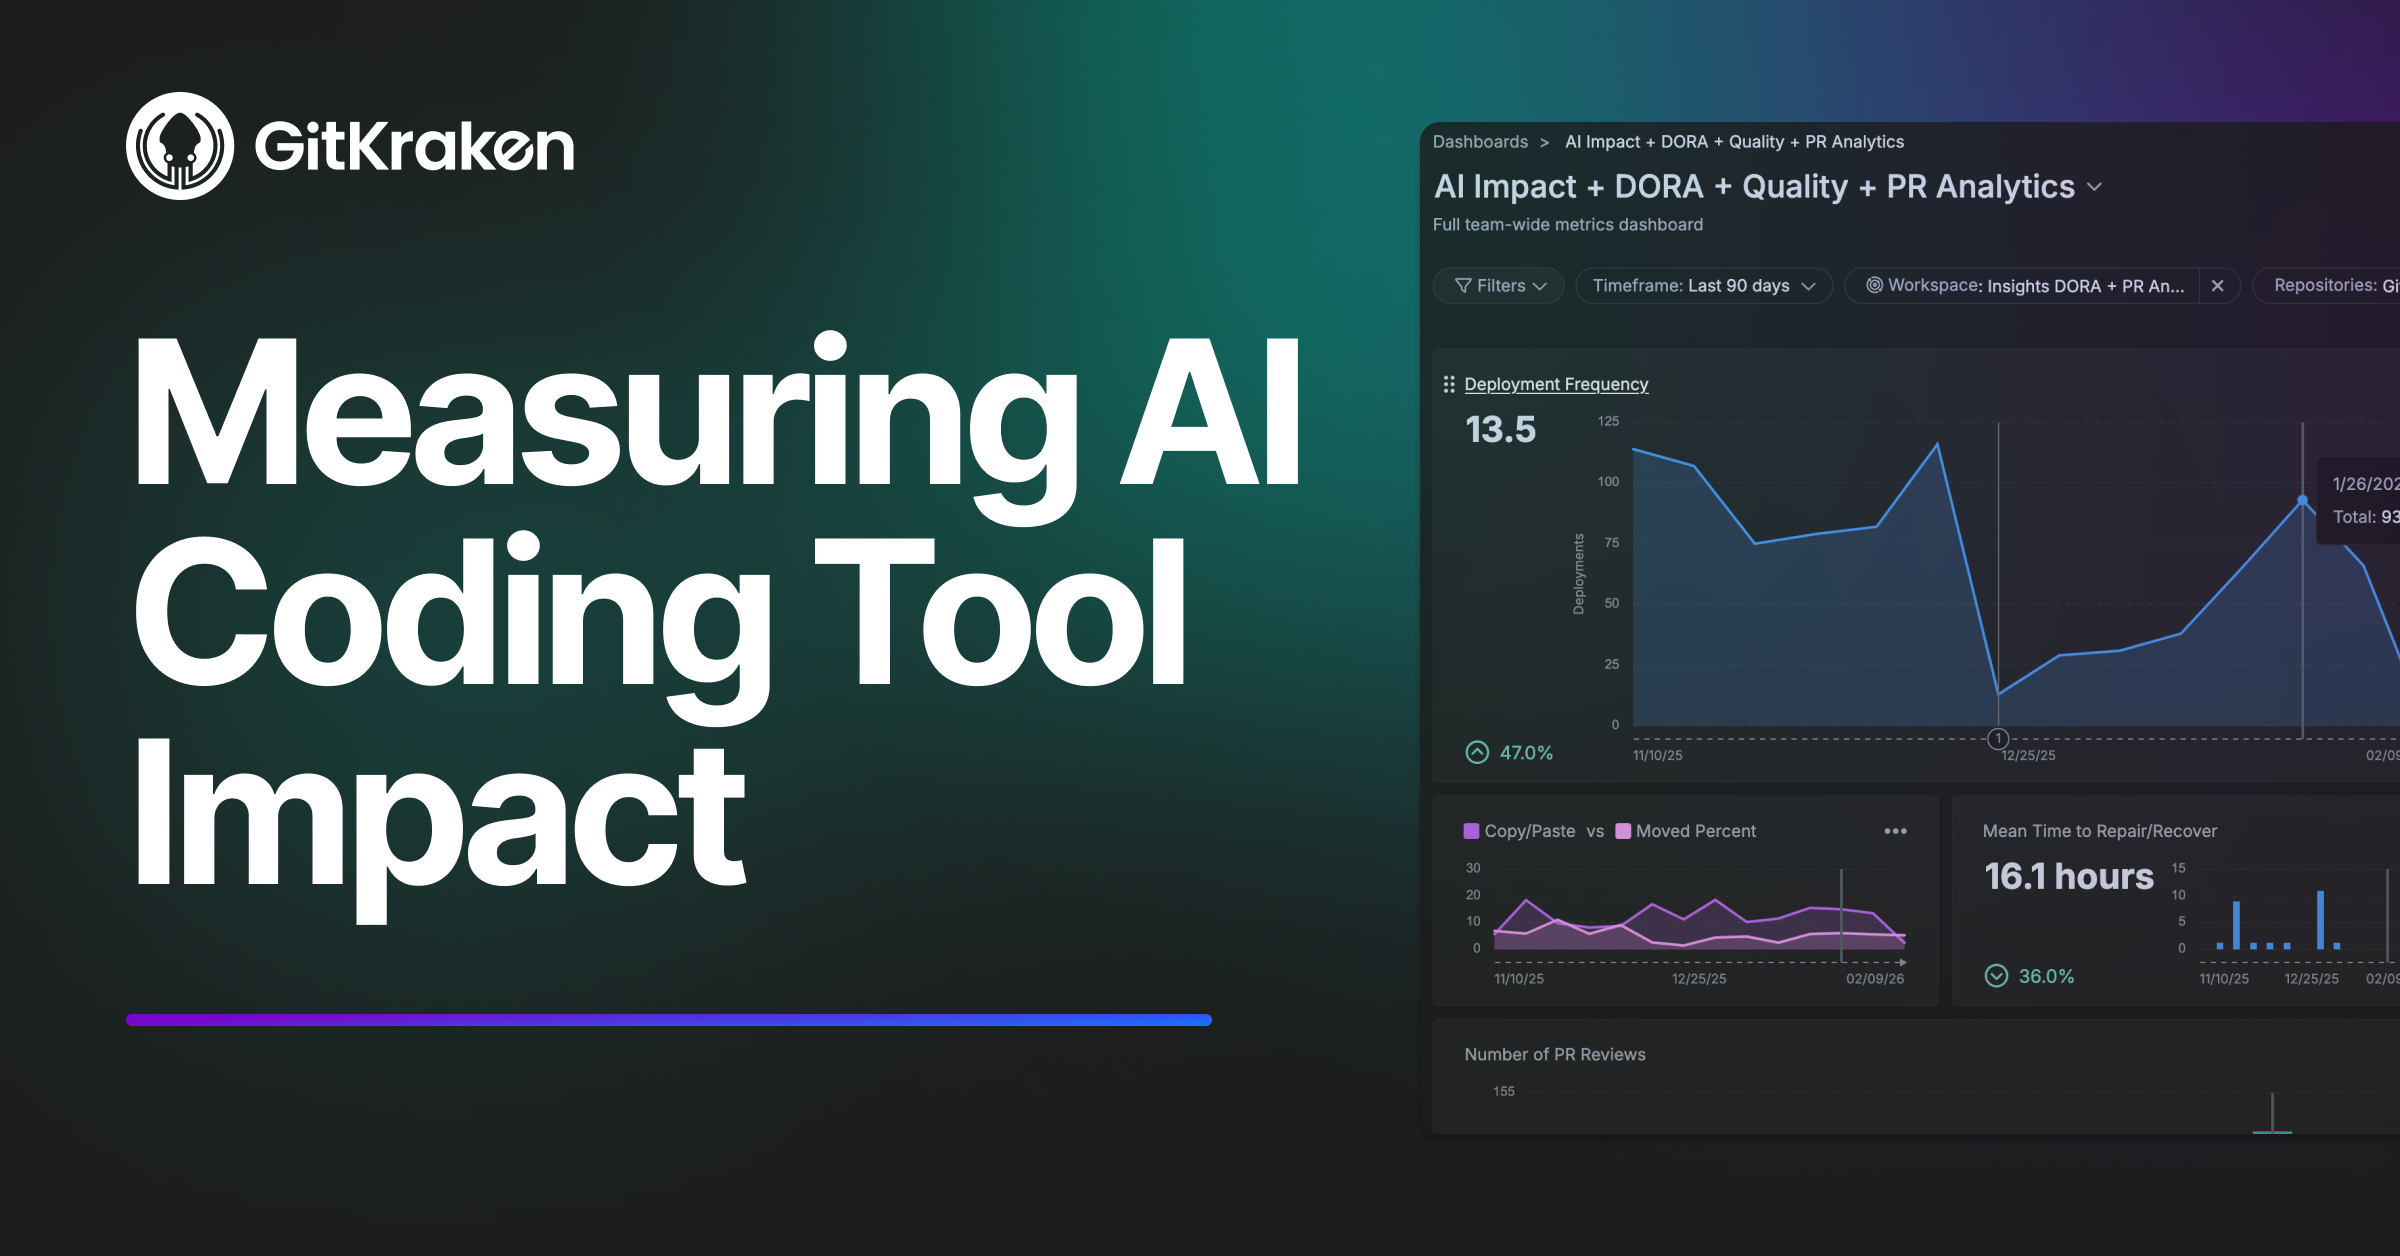
When we rolled out AI coding tools across our engineering team, the first few weeks felt great. Developers were enthusiastic. Acceptance rates looked healthy. Everyone said they felt more productive.
Then my CEO asked me a simple question: “Is it working?”
And I realized I didn’t have a good answer. Feeling productive and being productive are not the same thing. I could show acceptance rates and completions per day, but I couldn’t connect any of that to what actually matters – shipping quality software faster.
So we started measuring differently. And some of what we found surprised us.
The metrics your AI vendor gives you aren’t enough
Here’s the uncomfortable truth: the metrics that come with your AI coding tool are activity metrics, not outcome metrics. Acceptance rates tell you developers are using the tool. They don’t tell you if that usage is translating into better results. A developer can accept hundreds of suggestions per week and still ship at the same pace with the same quality.
Volume metrics are even trickier. More lines of code isn’t inherently valuable. If AI helps your team write more code that requires more fixing, you haven’t gained anything. You might have lost ground.
The questions I actually needed to answer were different: Are we shipping faster? Is the code holding up? And is this investment worth more than just hiring another engineer?
What we tracked instead
We started with a developer survey to gauge where teams were in their AI adoption. That gave us a useful starting signal, but we learned quickly that self-reported usage wasn’t reliable enough to measure impact. So we layered in objective tool engagement data from our AI coding vendors and grouped teams into high, medium, and low AI maturity based on rolling 4-week windows. That meant teams could move between maturity levels as their adoption patterns changed over time – and some did.
From there, in addition to measuring AI directly, we also started measuring what we already cared about – lead time, code quality, throughput, and efficiency – segmented by those adoption groups. All teams were tracked over the same twelve-month period, through the same deploy pipeline updates, the same process changes, the same product priorities. That way, when something diverged between groups, AI adoption was the most likely explanation.
The findings that mattered
High-adoption teams improved their speed 2-3x over the observation period. This was the clearest signal in our data. Lead time from first commit to production deployment dropped dramatically for teams that embraced AI tools. Teams that didn’t adopt saw essentially no change. If there’s one metric to watch, it’s this one.
Bug work increased proportionally, not disproportionately. More code means more bugs in absolute terms. The question is whether the defect rate is holding. In our case, it was. High-adoption teams were producing more overall output, and the bug count scaled with it – not ahead of it.
PR review time stayed flat, which was actually good news. External research (including the 2026 DORA report) highlights PR overload as a common side effect of AI adoption – teams generate more PRs than reviewers can handle. We didn’t see that. Our teams were keeping PRs small and reviewing AI output before submitting, not just accepting everything blindly. Discipline mattered as much as the tooling.
Code churn went up – and that was fine. This one initially worried me. When I saw churn trending up for our highest-performing teams, I went to the team leads expecting bad news. Instead, they told me they’d changed their development approach. AI tools let them prototype and ship leaner MVPs faster, then iterate based on real customer feedback. The increased churn wasn’t broken AI code getting fixed – it was intentional refinement. Same metric, completely different meaning depending on context.
More abandoned PRs meant more experimentation, not more waste. High-adoption teams abandoned more PRs than low-adoption teams. Sounds bad. But when AI cuts the cost of starting something, teams are more willing to try things that might not work out. As long as completed work is shipping faster and quality holds, elevated abandonment is a healthy sign.
Defect escape rate and mean time to recovery stayed flat. No major spikes in production incidents, no increase in how long it took to resolve them. This was the quiet confirmation that the speed gains were real and not being subsidized by downstream firefighting.
A framework for making sense of it all
These findings kept confusing us until we built a simple mental model around two dimensions: speed (is lead time improving?) and quality (is code churn or bug work stable?). That gives you four scenarios, each telling you something different about how AI adoption is landing.
When speed improves and quality holds, you’re in great shape – document what’s working and spread it. When speed improves but quality degrades, your team is probably moving faster than their review practices can support. When everything stays flat, adoption likely hasn’t reached critical mass, teams haven’t found effective ways to apply the tools yet, or the bottleneck is somewhere other than coding. And when speed is flat but quality is declining, something is genuinely wrong and you need to dig in by team to find out what.
We use this framework in every conversation with our team leads now. It replaced a lot of arguments about whether a particular number going up was good or bad. The framework gives us a shared language to interpret the data, not just stare at it.
What we actually did when we saw problems
Frameworks are nice. What matters is what you do when the data tells you something isn’t working.
When one team’s lead time improved but code churn spiked, we investigated and found they were accepting AI suggestions without adequate review. We didn’t penalize them. We paired them with a high-maturity team for a two-week knowledge-sharing rotation. Within six weeks, their churn stabilized while they kept the speed gains.
When other teams had access to AI tools but showed flat metrics, we ran a survey and found two bottlenecks: developers didn’t know when to use the tools effectively, and PR review capacity – not coding speed – was the real constraint. We ran internal sessions where high-adoption developers shared their workflows, and we added review bandwidth. Within 90 days, those teams started improving.The pattern that keeps coming back: the data tells you where to look, not what to do. You still have to talk to your teams.
One thing I’d do differently
I wish I’d shared the dashboards with team leads from day one instead of treating them as management reporting. The moment I started sharing openly, everything changed. Teams started asking questions, proposing experiments, and taking ownership of their own metrics. That’s when measurement stopped being surveillance and started being useful.
If you’re tracking this stuff, let your teams see what you see. Measure teams, not individuals. Focus on improvement, not judgment. The best results happen when engineers use metrics to improve their own work, not when managers use metrics to pressure them.
Where to go from here
We wrote up the full methodology – the specific metrics, the framework, the data, and the step-by-step process for setting up your own baseline – in a practical guide. If you’re trying to answer “is AI working?” for your organization, it’ll save you some of the trial and error we went through.
Download the full guide: How to Measure the Impact of AI Coding Tools →
And if you want to talk through how this applies to your team specifically, we’re offering open office hours for engineering leaders. No sales pitch – just a conversation about what’s working for us and what we’ve seen work for others.


 GitKraken MCP
 GitKraken Insights


